Ozone Applications

Ozone Inactivation of E.Coli at Various O3 Concentrations and Times
Antimicrobial Effects of Ozonated Water Against Generic E.coli on Swine Intestines Varying Ozone Concentrations and Exposure Times:
SIG International Iowa Food Laboratory
Authors: George Kraft, Kraft Science Consulting, 821 Main Street, Boyden, IA 51234
Swine intestines harvested then turned inside-out and washed with cold water to remove all visible contaminants were tested to have a generic E.coli load of 6 to 7.5 logs per gram of tissue. Samples of these tissues were treated with ozonated water at various concentrations for various lengths of time up to a total of 30 seconds. It was determined that concentrations below 1 ppm had no significant anti-E.coli effects at any of the exposure times tested. At 1 ppm and above significant kills were achieved with a 1 second exposure time. At 1 ppm and up to 2.5 ppm a 15 second exposure time was needed to achieve the greatest E.coli kill, and at 3 ppm and above a 1 second exposure time was all that was needed to achieve the greatest E-coli kill.
Materials:
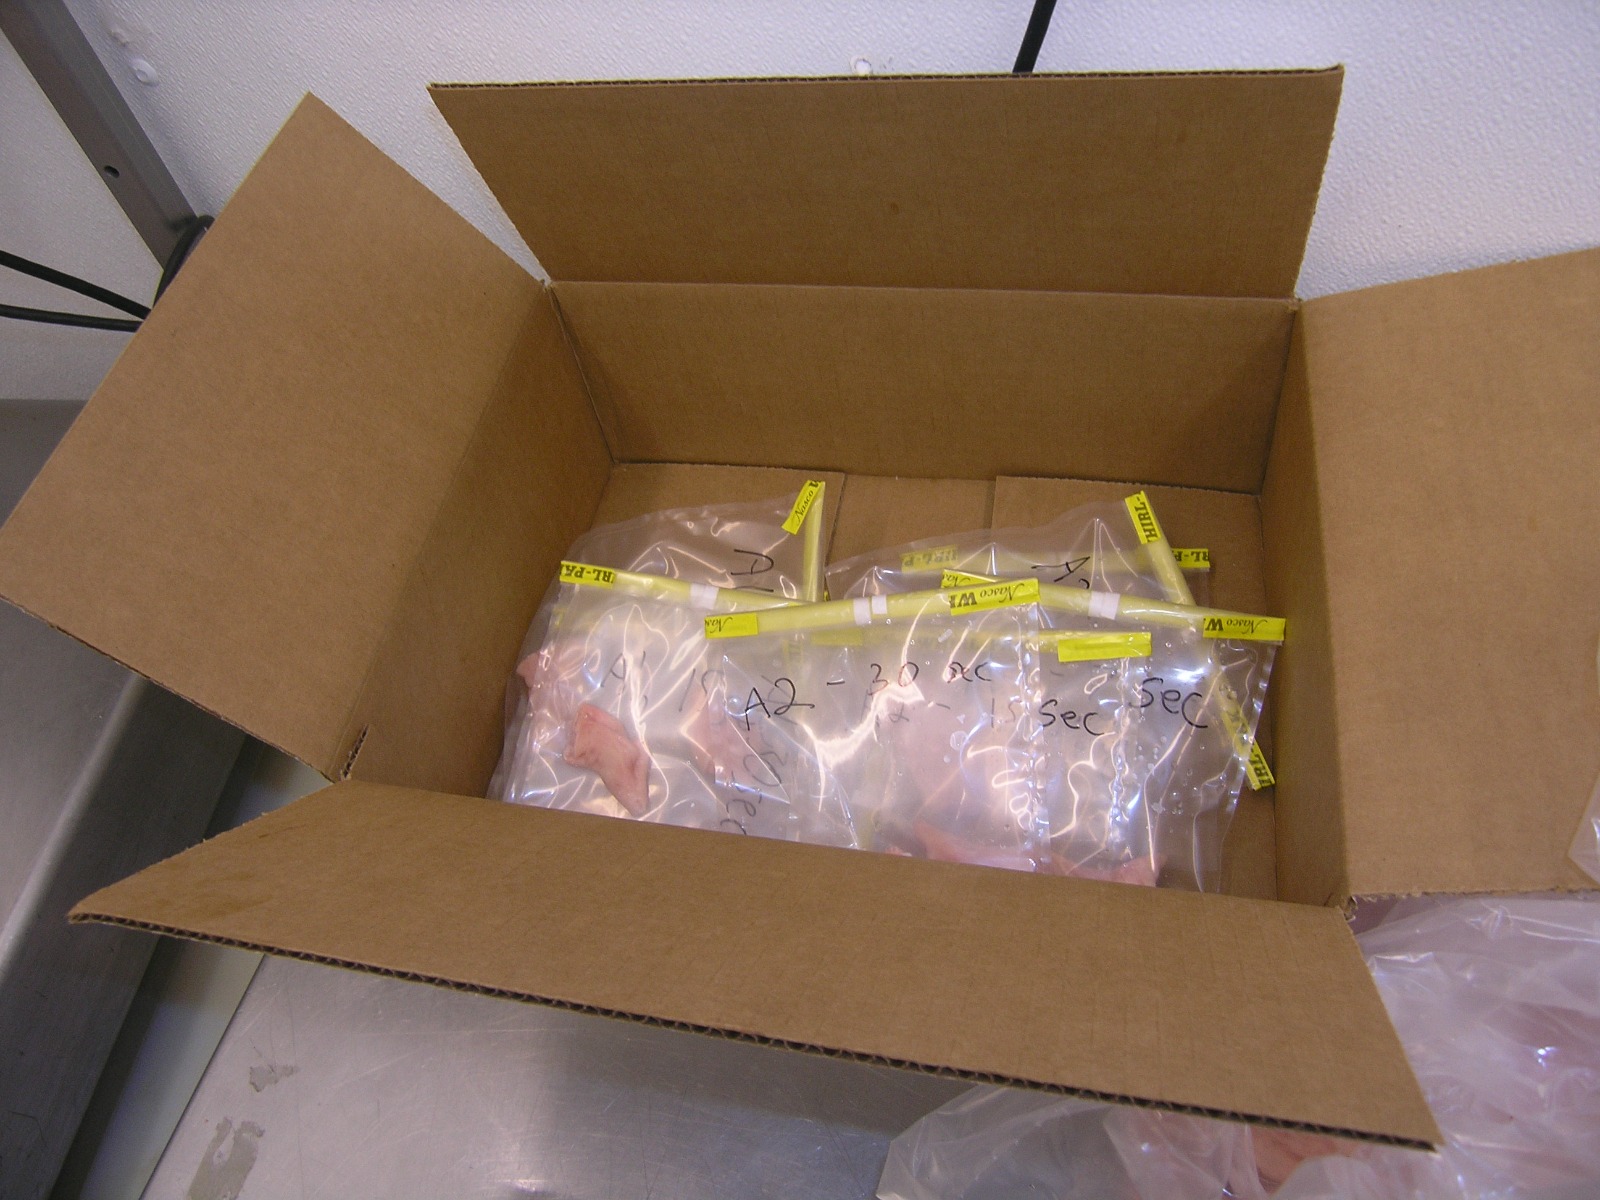
- Approximately 600 cm of freshly harvested swine intestine
- 120 sterile Whirl-Pak sampling bags
- 1.2 Liters of sterile Butterfield’s buffer
- 120 Petrifilm plates for generic E. coli
- 1 10 ml sterile graduated cylinder
- 1 electronic pipette (1 ml)
- 120 sterile disposable pipette tips
- 1 gram scale
- 1 incubator set at 36 degrees centigrade
- 1 sharp knife
- 4 hemostat forceps (5 ½”)
- Swine intestine washing bar
- 180 degree F water
- Ozonated water at various concentrations
- CHEMets ozone concentration test kit
- Distilled water
Methods:
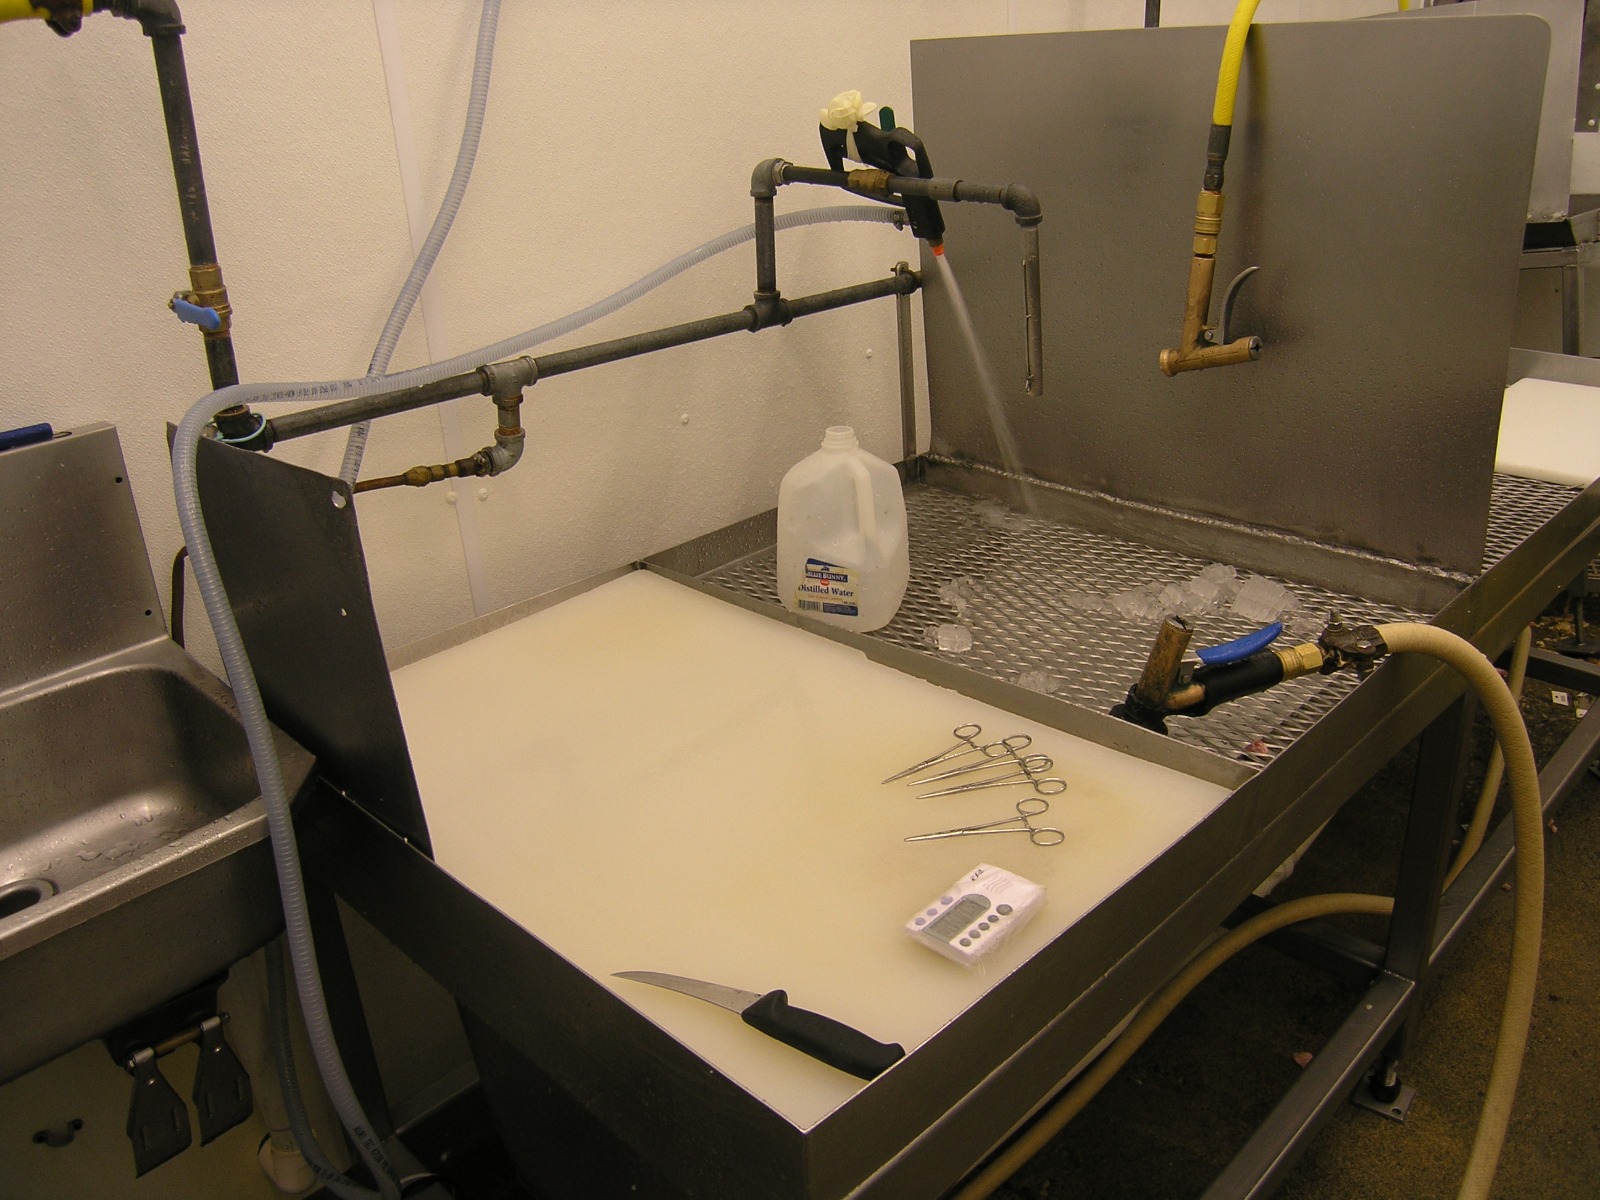
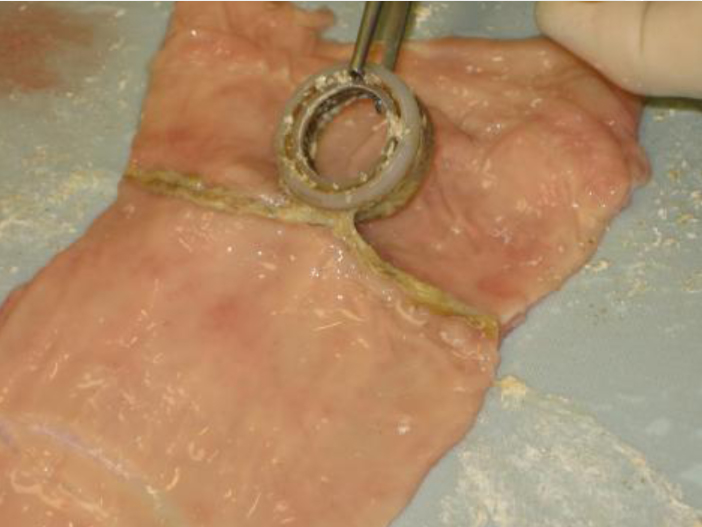
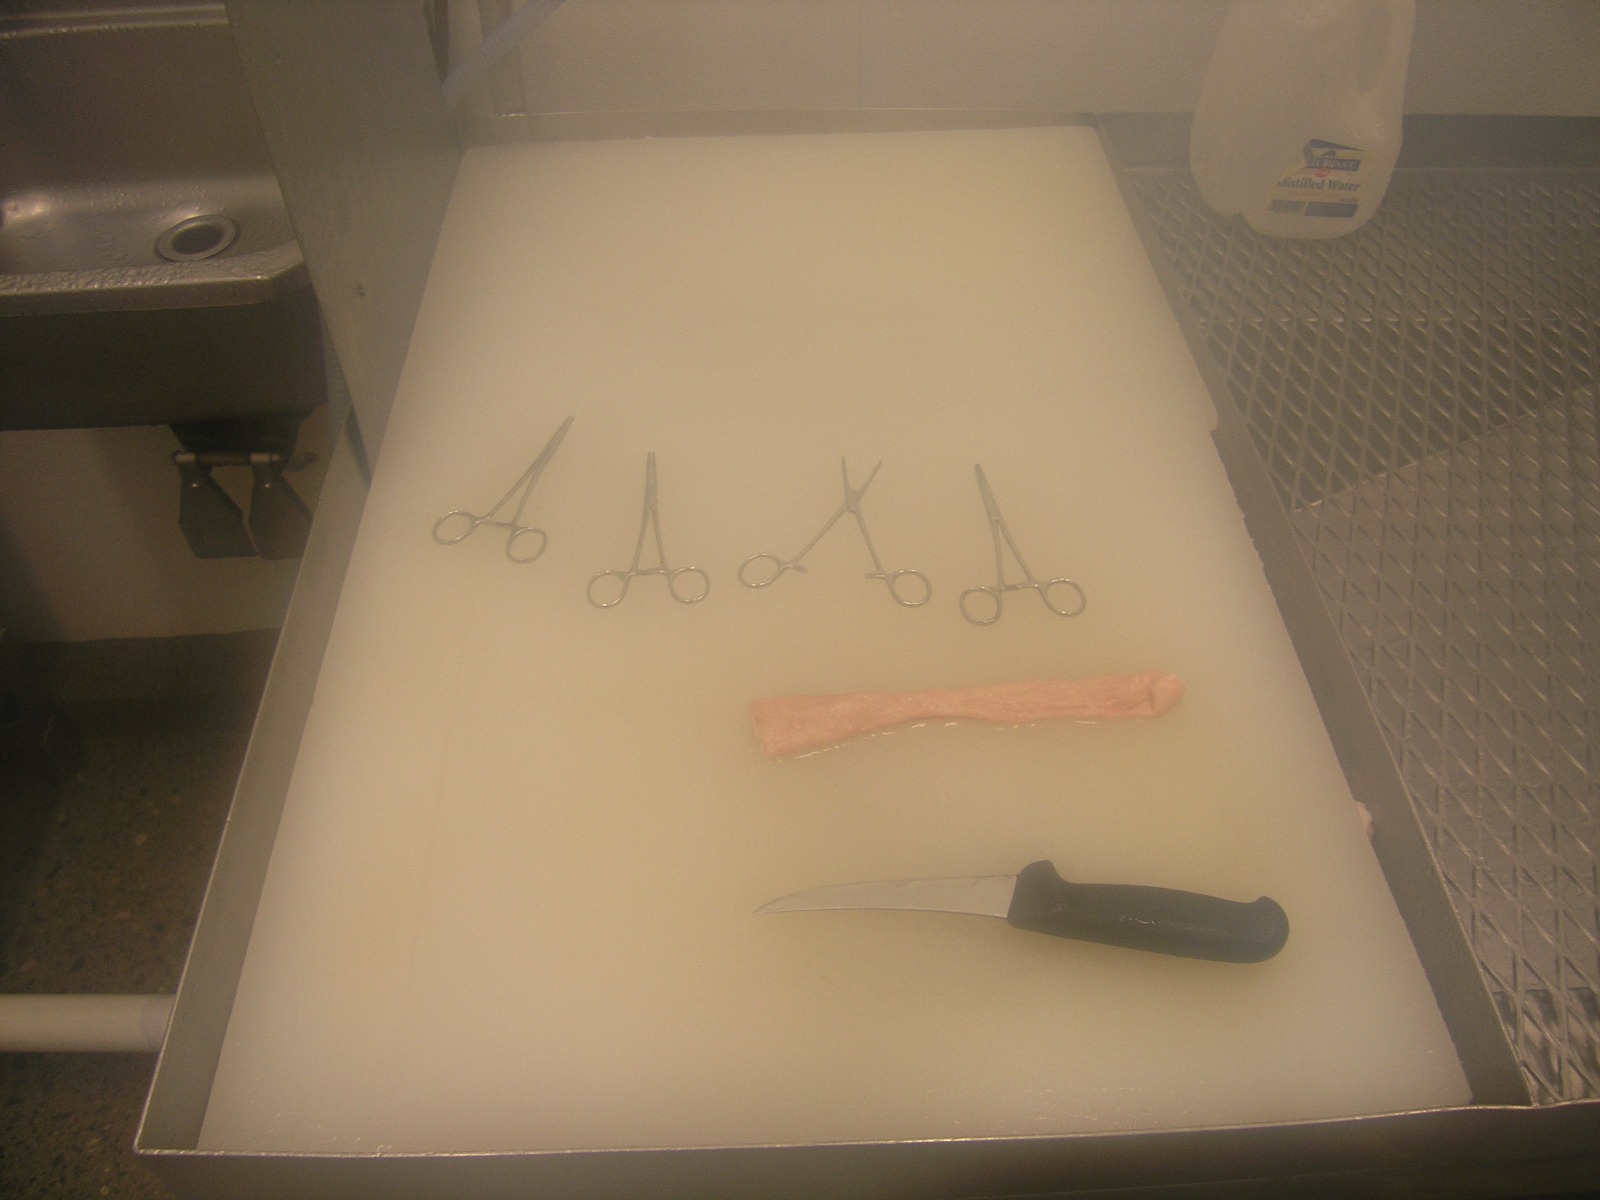
Sample Exposures - The equipment that provides ozonated water continuously flowing from a nozzle with a circular output approximately 1 cm in diameter and at a flow rate of 3 gpm was adjusted so that the concentration of ozone was below 1 ppm. Then, a freshly harvested swine intestine was washed by sliding it onto a wash bar that emits non-heated municipal water. A barb on the end of the bar catches the end of the intestine so that it is turned inside-out as it is removed from the wash bar. This process removes all visible contamination from the intestine. On a work surface sanitized with 180 degree F water a 25 cm long section of this intestine was cut out, then this section was cut into 5 pieces each approximately 5 cm long. One of the pieces was immediately placed into a sterile Whirl-Pak sampling bag to be analyzed later as the non-treated control. Each of the 4 remaining pieces were placed directly under the stream of ozonated water using a hemostat forceps one at a time for 1 second, 7 seconds, 15 seconds and 30 seconds, respectively. Immediately after each exposure the tissue sample was placed into a sterile Whirl-Pak bag and labeled as per its exposure time. All of the above was then repeated 2 more times for a total of 3 complete sample sets for this concentration. The ozone equipment was then adjusted to achieve a different concentration and the above was performed which generated another 3 complete sample for this new concentration. A total of 8 different concentrations were used and at each concentration 3 complete sample sets were generated. Note that the work surface and wash bar were sanitized with 180 degree F water between each sample set.
Sample Preparation, Plating and Analysis – Each sample was weighed and 50 ml of buffer added. After adequately stomaching each sample plating and incubation occurred as per AOAC Official Method 998.08. All plates were enumerated and after calculations the results were entered into a table as logs of cfu per gram of tissue.
Results:
In Trial A, which involved a 0.7 ppm concentration of ozone, there was no detectable decrease of E.coli when compared to the control for any of the exposure times and for all 3 sets of samples in this trial.
In Trial B, which involved a 1 ppm concentration of ozone, there was a significant decrease of E.coli after a 1 second exposure and after 15 seconds all E.coli exposed to the ozone (see the Discussion section of this report for clarification) were effectively killed.
In Trial C, which involved a 1.5 ppm concentration of ozone, there was little difference seen between this trial and Trial B.
In Trial D, which involved a 2 ppm concentration of ozone, there was a noticeable difference between this and any trial before this. It was observed that after the first second of exposure almost all exposed E.coli were killed and after 7 seconds all exposed E.coli appeared to be killed based on the data.
In Trial E, which involved a 2.5 ppm concentration of ozone, there was little difference seen between this trial and Trial D.
In Trial F, which involved a 3 ppm concentration of ozone, the data suggests that all exposed E.coli were killed after a 1 second exposure.
In Trial G, which involved a 3.7 ppm concentration of ozone, the data suggests that all exposed E.coli were killed after a 1 second exposure. It could be argued that further decrease is observed for the longer exposures but the difference may not be statistically significant.
In Trial H, which involved a 4.4 ppm concentration of ozone, the results were the same as in Trial G except that further decrease with longer exposure is more evident in this trial (see the Discussion section of this report).
| Trial # | Concentration | 0 sec | 1 sec | 7 sec | 15 sec | 30 sec |
| A1 | 0.7 ppm | 6.2 | 6.4 | 6.1 | 6.3 | 6.2 |
| A2 | 0.7 ppm | 4.9 | 5.2 | 5.1 | 4.8 | 5 |
| A3 | 0.7 ppm | 5.4 | 5.3 | 5.6 | 5.2 | 5.1 |
| B1 | 1 ppm | 6.4 | 4.9 | 4.4 | 2.4 | 2.5 |
| B2 | 1 ppm | 7.8 | 6.3 | 4.3 | 2.6 | 2.3 |
| B3 | 1 ppm | 7.1 | 5.8 | 4.3 | 2.3 | 2.4 |
| C1 | 1.5 ppm | 6.3 | 4.6 | 3 | 3.2 | 3.7 |
| C2 | 1.5 ppm | 6.9 | 4.1 | 3.1 | 2.5 | 3.3 |
| C3 | 1.5 ppm | 5.1 | 4.9 | 3.8 | 3.2 | 2.1 |
| D1 | 2 ppm | 5.9 | 2.3 | 2.2 | 2.2 | 2.2 |
| D2 | 2 ppm | 5.4 | 2.5 | 2.4 | 2.1 | 2.1 |
| D3 | 2 ppm | 6.8 | 2.7 | 2.5 | 2.4 | 2.5 |
| E1 | 2.5 ppm | 6.1 | 3.1 | 2.9 | 2.5 | 2.1 |
| E2 | 2.5 ppm | 6.9 | 2.6 | 2.8 | 2.4 | 2.4 |
| E3 | 2.5 ppm | 5.1 | 2.9 | 2.8 | 2.3 | 2.3 |
| F1 | 3 ppm | 5.4 | 2.7 | 2 | 2.1 | 2.2 |
| F2 | 3 ppm | 6.2 | 2.3 | 2.3 | 2.5 | 2.2 |
| F3 | 3 ppm | 6.9 | 3 | 3.1 | 3.1 | 3.1 |
| G1 | 3.7 ppm | 5.9 | 2.3 | 2.2 | 2 | 1.9 |
| G2 | 3.7 ppm | 6 | 2.4 | 2.2 | 1.9 | 1.4 |
| G3 | 3.7 ppm | 6.1 | 2.4 | 2.1 | 2.3 | 2.2 |
| H1 | 4.4 ppm | 6.2 | 2.2 | 1.8 | 2 | 1.6 |
| H2 | 4.4 ppm | 6.5 | 2.5 | 1.7 | 2 | 2.1 |
| H3 | 4.4 ppm | 6.9 | 2.3 | 1.5 | 1.6 | 1.3 |
The chart below shows the amount of bacteria present after the indicated number of seconds of exposure to ozonated water for each of the 8 ozone concentrations used in the experiment. All samples had 6 to 7.5 logs of bacteria (cfu/gram) to start with, and the first values seen in the chart indicate the bacteria present after a 1 second exposure.
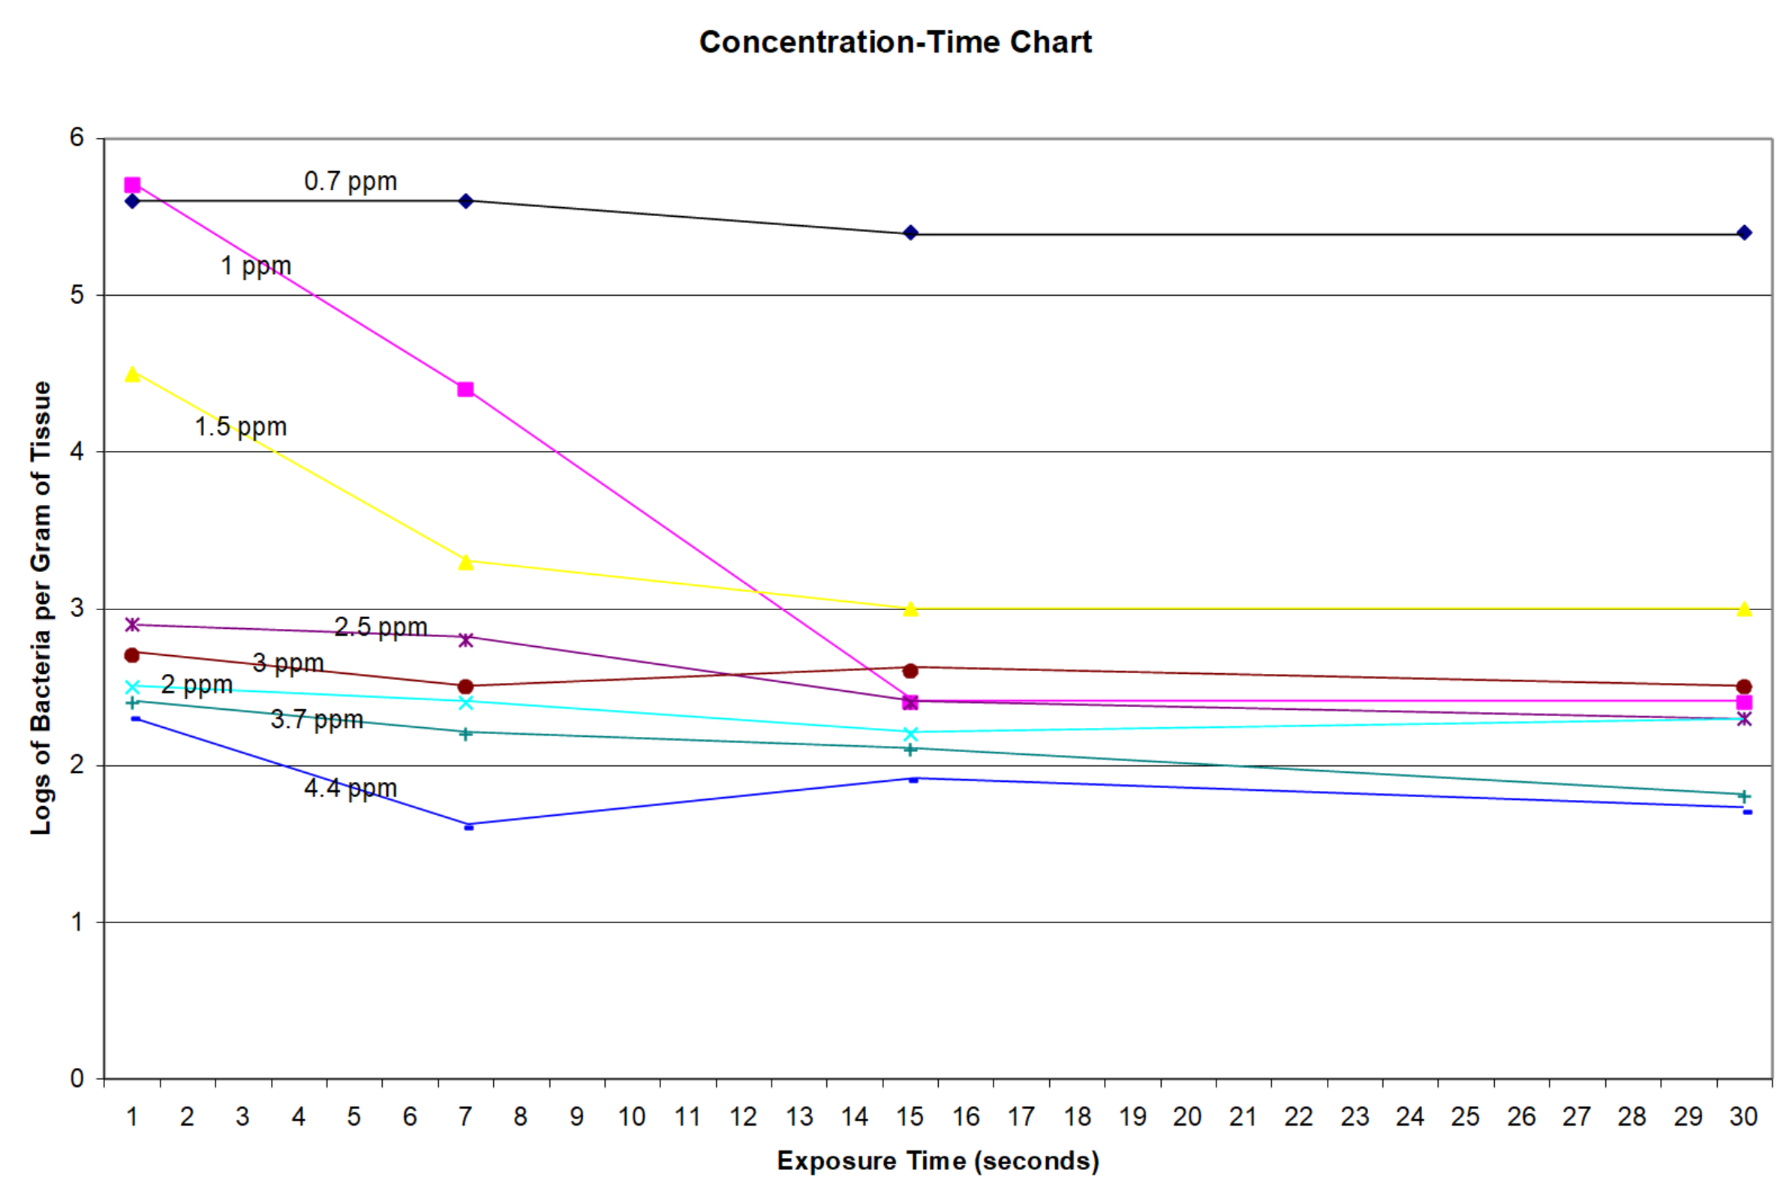
The table below shows the average log reductions achieved using the indicated concentrations of ozone and after the indicated times of exposure to ozonated water. It can be seen from the table that after a certain number of seconds the further reduction of bacteria upon continued exposure becomes negligible. The bacteria left after this point is assumed to have not been exposed to ozonated water during the experiment due to the nature of the test tissues (see the Discussion).
| 1 second | 7 seconds | 15 seconds | 30 seconds | |
| 0.7 ppm | * | * | * | * |
| 1 ppm | 1.4 | 2.7 | 4.7 | 4.7 |
| 1.5 ppm | 1.6 | 2.8 | 3.1 | 3.1 |
| 2 ppm | 3.5 | 3.6 | 3.8 | 3.8 |
| 2.5 ppm | 3.1 | 3.2 | 3.6 | 3.7 |
| 3 ppm | 3.5 | 3.7 | 3.7 | 3.7 |
| 3.7 ppm | 3.6 | 3.8 | 3.9 | 4.2 |
| 4.4 ppm | 4.2 | 4.9 | 4.6 | 4.8 |
Bacterial reduction was negligible for the indicated exposure time.
Discussion:
Each sample piece was held directly in the stream of ozonated water, which was flowing at a rate of 3 gpm, for the specified amount of time. While this ensured full continuous coverage of the entire external surface of the intestine (which was actually the inside mucosal surface of the intestine before it was turned inside-out) throughout the specified amount of time there were still internal parts of the intestine with little to no exposure to the ozonated water. It can be assumed based on harvest procedures that there would be some E.coli contamination here that was not getting exposed to the ozonated water. This is supported by the fact that at higher ozone concentrations there was a significant log reduction of E.coli after the first second then each sample thereafter had about the same amount of E.coli which never approached zero. It is therefore assumed that these bacteria were on the inside of the intestine and never exposed. These bacteria would make it out into the buffer solution during stomaching and would therefore be counted at analysis. At the very highest concentrations in this experiment there appeared to be a continued decrease in E.coli, although small, even after the decrease had leveled off. This could be explained in that some ozonated water made its way inside the intestine during each sample treatment but the kill it was achieving could only be noticed at the very highest concentrations, namely Trial G and especially Trial H.
A brief discussion about the exposure times is warranted in that a given sample of ozonated water (rather than a continuous flow) will slowly lose its ozone over time for various reasons. It is generally accepted that ozone will last about 20 minutes in a given sample of ozonated water. Given this, even with the 1 second exposure times there would still be some residual antimicrobial effects of the ozone after the sample was placed into the bag until it was either consumed by causing continued microbial kill or it dissipated from solution. Obviously, the higher the concentration of ozone in the water the more ongoing kill will take place in the sample bag.
Conclusions:
This experiment shows how much exposure time is needed for a given concentration of ozone in ozonated water to achieve a significant kill of generic E.coli. A significant kill may be defined as a 1 to 2 log reduction of the E.coli bacterial load. Based on these results, ozonated water with an adequate concentration of ozone would make a good sanitizer for such applications as a fixed-location spray bar spraying a moving conveyor, where any given point on the surface of the belt may get sprayed for only a second as it moves by.
This experiment shows that an ozone concentration of less than 1 ppm has little efficacy against E.coli, at least for 30 seconds or less of exposure. It also shows that there is very little difference in efficacies between a 1 ppm and a 1.5 ppm concentration but a considerable increase in efficacy is seen at the 2 ppm concentration and above. The data shows that a 2 log reduction or better can be achieved on the outer surface of these 5 cm long samples using ozonated water at a flow rate of 3 gpm with only 1 second of exposure when ozone concentrations are 2 ppm or greater.
More info on ozone in food processing HERE
More info on ozone reduction of E.coli O157:H7 HERE