Ozone Generator Performance Chart Defined
Importance of an ozone generator performance chart:
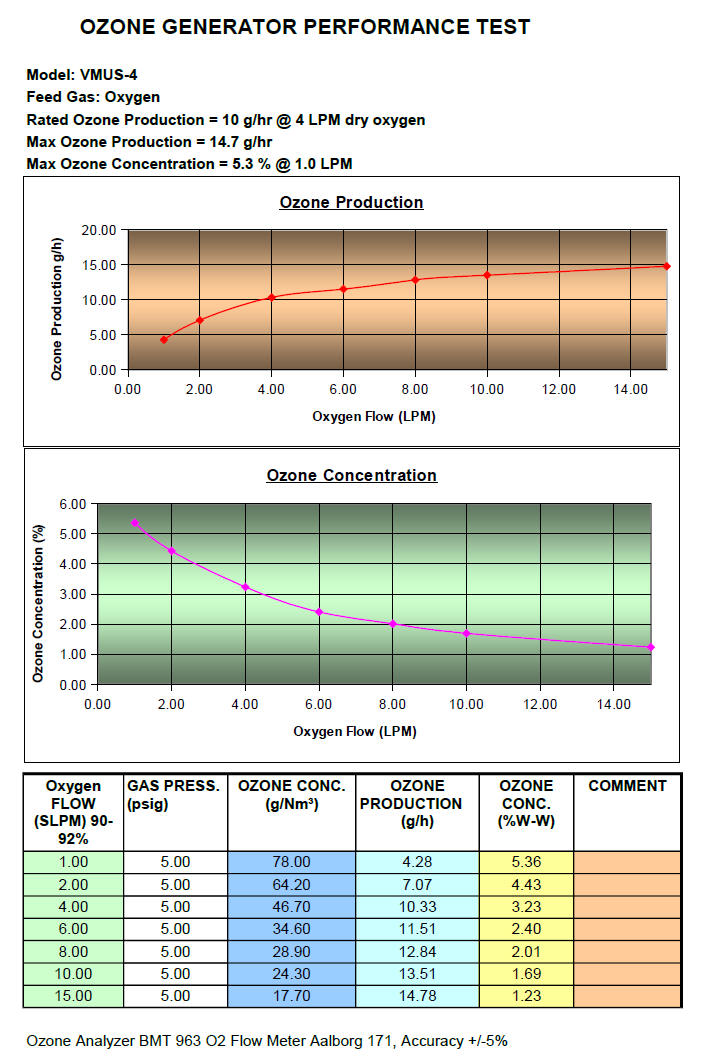
Ozone generator performance must be measured and tested to quantify the production of ozone. For most applications, ozone production is the number one factor in choosing an ozone generator for that application. Therefore, it is imperative a reliable performance chart be reviewed prior to the purchase of any device that may produce ozone.
Image below is given as an example of an ozone generator performance chart:
An ozone generator performance chart may show various data in relationship to ozone production or concentration. Below are some definitions of this data and what you might look for.
Ozone Production:
Ozone production is commonly shown in g/hr, but also may be shown in mg/hr, lb/day or another unit of measure. The ozone production value must be shown in a mass over time value that indicates mass of ozone produced in a given period of time. This value is a calculated value based on ozone concentration and feed-gas flow rate.
Ozone Concentration:
Ozone concentration is a measurement that shows the ratio of ozone to feed-gas produced from the ozone generator. This is real-time measurement that is obtained via a high concentration UV Ozone Analyzer. Ozone concentration may be shown in % by weight, g/m3, or another unit of measure that illustrates a mass of ozone at a given moment.
Feed-Gas:
The ozone generator feed-gas may be oxygen, or air. This information must be present to determine what gas was used, and what gas must be used to achieve the same results. Oxygen purity, or air dew-point values would be helpful information.
Flow-Rate:
The flow-rate of gas must be given to show the required flow-rate to achieve the reported ozone concentration and calculated production. Ensure that measured flow is compensated for pressure as manual float type flowmeters readings need to be calculated for pressure. We have found some performance charts that were created using direct readings from manual flow meters without calculating for pressure, this gives a false low flow-rate, false high ozone concentration, and false high ozone production rate.
Feed-Gas Pressure:
Feed-gas pressure would indicate the pressure of fed-gas on the ozone generator corona cell. Some ozone generators ozone production will rise or fall as gas pressure on the corona cell changes. Therefore you might see a performance chart show the relationship between ozone production and pressure.
Power Setting:
The power setting of the ozone generator could be shown to illustrate how ozone production varies with changes in the adjustable ozone output dial or remote signal. This could be shown in a % or specific indication of the dial.
Power Consumption:
Power consumption could be shown in relationship to ozone production to show the net result or change of power consumption based on the power setting value on the ozone production. This would illustrate energy consumed by the ozone generator for a specific ozone production rate. This information could be used to determine electrical efficiency of the ozone generator.
More Info:
-Common ozone units of measure (if you need to convert any units)
-Understand how to interpret ozone generator performance charts


