Ozone Applications

How to read a Venturi Injector performance Chart
How to read a Venturi Injector Performance Chart:
The Mazzei Venturi Injector is incredibly predictable and reliable in the performance of liquid flow and gas suction. Using the performance chart provided by Mazzei allows for accurate planning and engineering of your ozone system. However, a proper understanding of this performance chart is necessary.
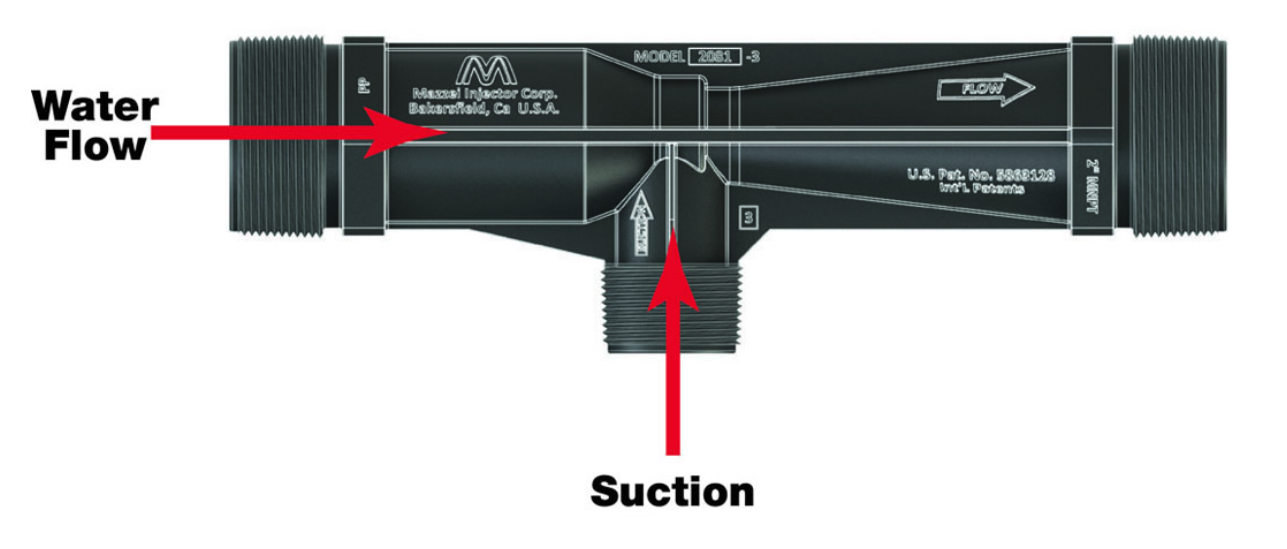
Image of a Venturi Injector: Water flows from left to right; ozone is introduced into the middle.
Below is a chart for a common venturi injector. The injector is capable of mixing both liquid and gas into the main water flow through the venturi injector. For the purpose of dissolving ozone gas into water, the 3rd and 4th columns can be ignored completely as these refer to liquid suction only.
The first column is the injector inlet pressure, which is the pressure provided to the venturi injector inlet. The 2nd column is the injector outlet pressure, which is the pressure exerted on the injector outlet from delivering the water to the point of use. The 3rd column called MOTIVE FLOW states the flow rate of water going through the injector based on inlet/outlet pressures. This is what allows the proper pump to be chosen, calculate gas to liquid ratios, and more. The last column called AIR SUCTION lists the amount of gas (oxygen, ozone, air), that can be sucked into the water stream at these aligned injector inlet/outlet pressures. As can be seen from the chart, as injector outlet pressure (2) increases, injector suction decreases (4). This is true even though the motive flow (3) stays relatively constant.
Columns:
1. Injector inlet 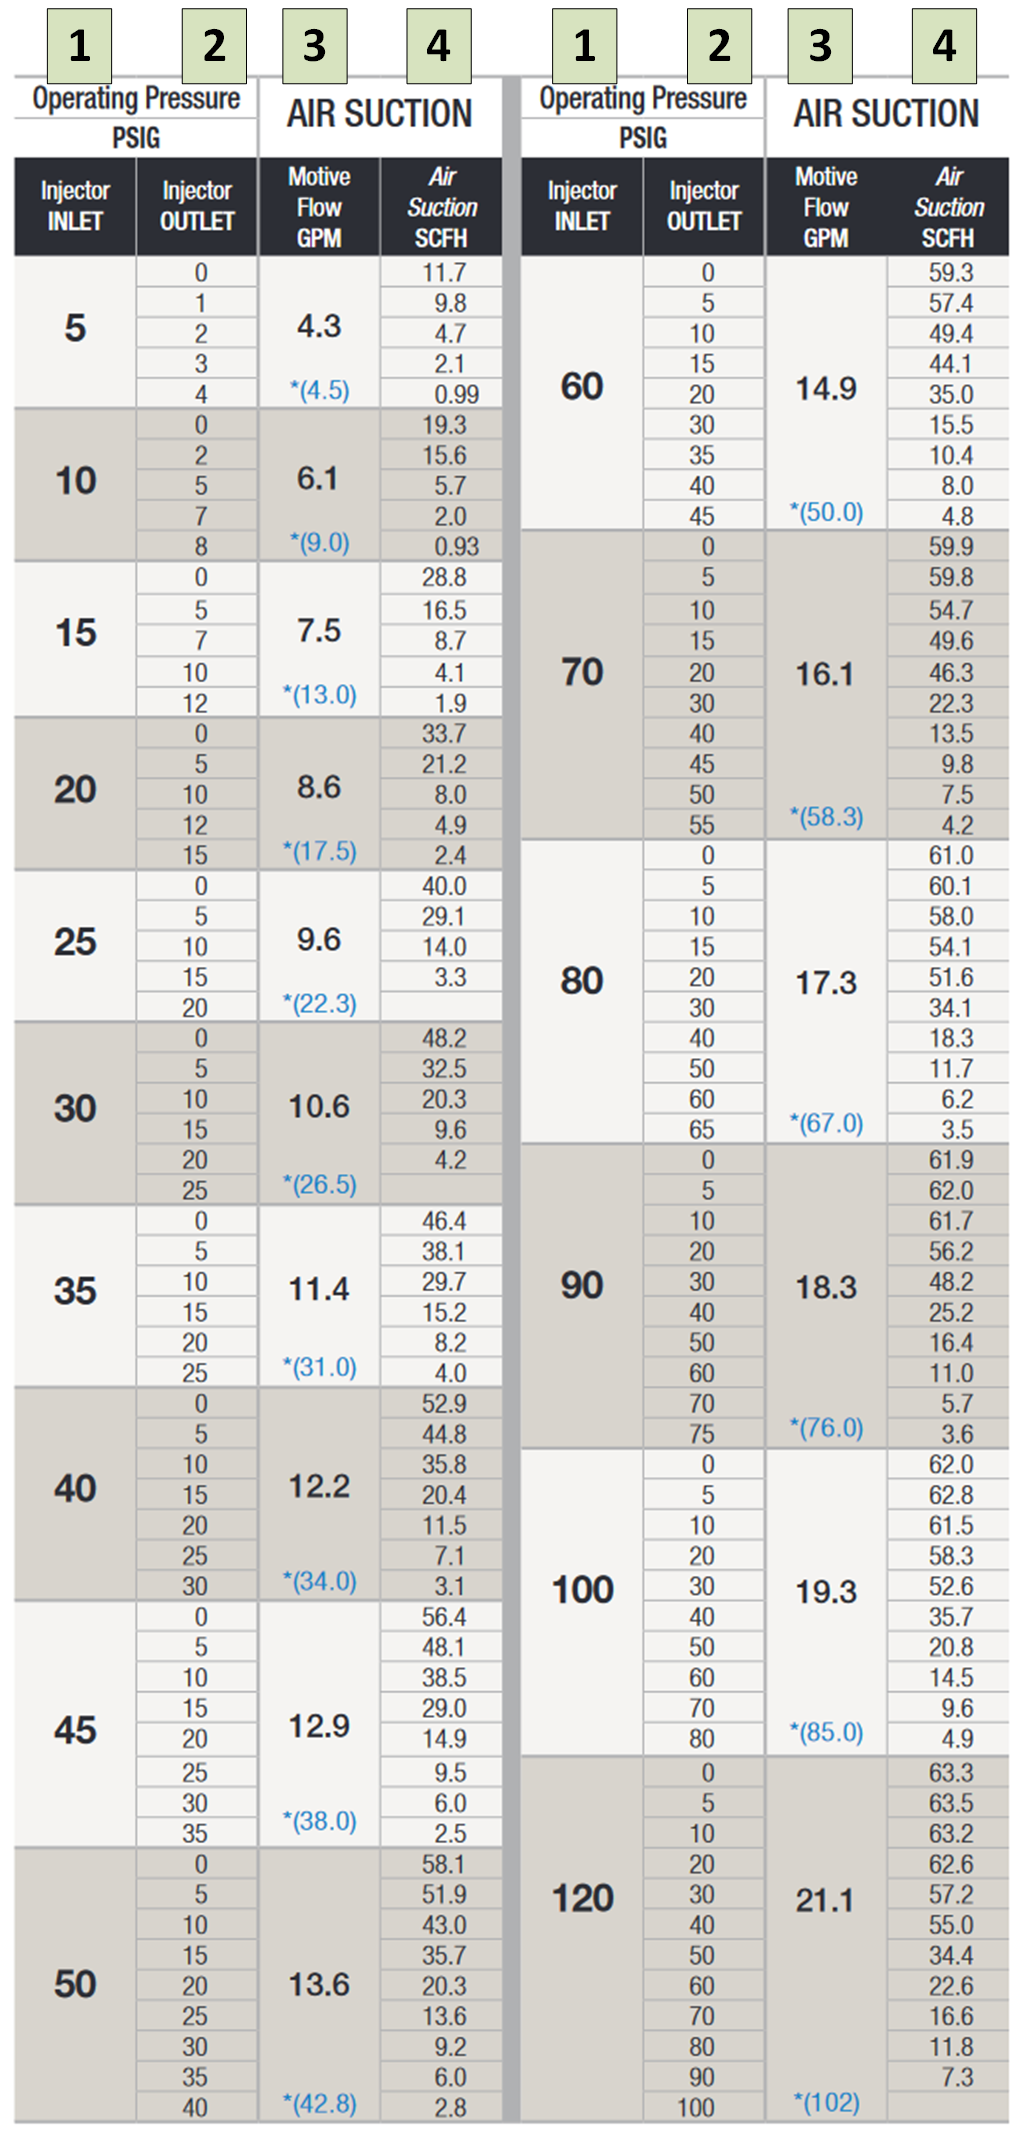 pressure – water pressure at the inlet of the venturi injector, can be measured with a pressure gauge at the inlet of the venturi injector
2. Injector outlet pressure – water pressure at the outlet of the venturi injector, can be measured with a pressure gauge at the outlet of the venturi injector
3. Motive water flow – Indicates the actual water flow that will flow through the venturi based on inlet/outlet pressures as measured.
4. Air Suction – Indicates the ozone/oxygen/air gas suction created by the venturi based on inlet/outlet pressures as measured.
Example:
A pump delivering 18 GPM @ 15 PSI can inject a maximum of 20 SCFH of ozone gas if 7 PSI of injector outlet pressure exists.
If more suction is needed two options exist: Increase the size of the pump or decrease injector outlet pressure by increasing the diameter of the pipe, reducing the number of elbows or lowering the height the delivered water.
View our full line of Venturi Injectors HERE
Additional Information Links:
Ozone Dosage vs Dissolved Ozone
Dissolve Ozone into water with Bubble Diffuser
Dissolve Ozone into water with Venturi Injector
Dissolve ozone into water with Static Mixer
Compare Venturi Injector and Bubble Diffusers